

/dash opens a live graph of the runtime in your browser. Every agent, every LLM request, every tool call, every skill that activates, every MCP server, every harness pattern that fires, every background job and every outbound connection is a node; an edge pulses each time something happens on it.
It is end-to-end telemetry with no setup: no collector, no agent, no account. It is off by default and costs nothing while off.
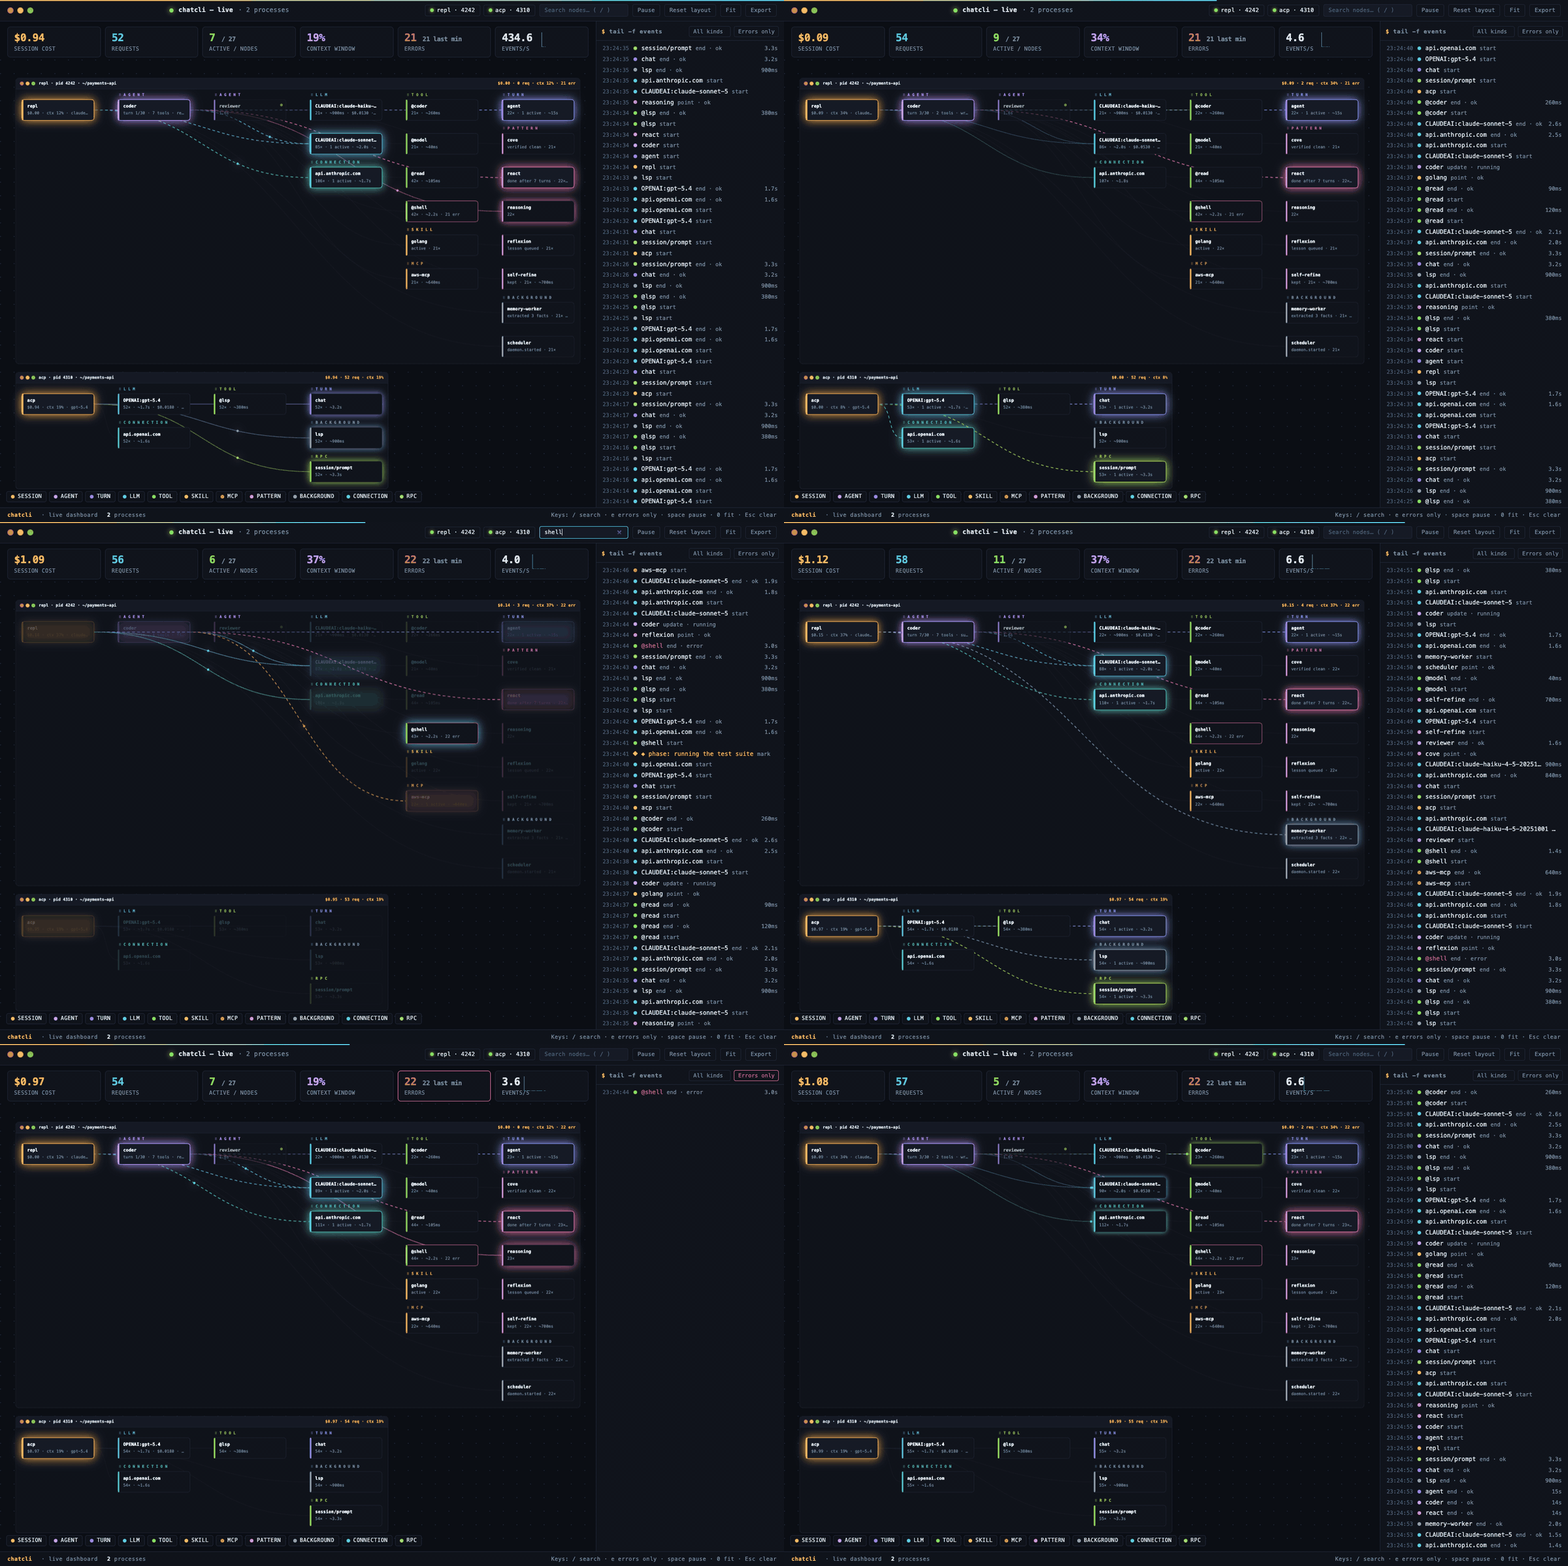
Live: edges pulse and the feed tails as things happen; / searches the graph (here for the shell tool), e narrows the feed to errors. (Synthetic data.)
Opening it
/dash works while a turn is running (type it mid-run) and over ACP, where the address comes back to the IDE chat.
The browser only opens from an interactive terminal. From a daemon, a pipe or an IDE, the address is printed instead.
It sees every process, not just this one
Opening the dashboard makes every chatcli process on the machine start reporting: the REPL you typed/dash in, a second terminal, the gateway daemon, the ACP agent inside your IDE, the MCP server another client is driving, the scheduler daemon. Each one is a band on the page.
This is what chatcli dash is for: the ACP agent, the MCP server and the daemons have no prompt to type /dash into, and their stdout is a protocol stream. A dashboard in another terminal is the only window into them.
How recording turns on and off
- Whoever serves a dashboard keeps a small lease file renewed under
~/.chatcli/pulse/. - Every chatcli process checks that lease every two seconds. While it is unexpired, the process records to its own spool.
- The lease is renewed only while a browser is actually polling. Close the tab, and about 30 seconds later every process goes quiet again on its own. Nothing stays on by accident.
.env takes effect on /reload.
What you see
Sessions and agents are one node each, linked by their real parent, so a multi-agent dispatch reads as a tree. Everything else is a hub aggregated by name (the@coder tool, the github MCP server, the self-refine pattern) showing calls, how many are active right now, errors and average latency. The graph stays stable and fires, instead of exploding into one node per call.
The seven patterns, with outcomes
Self-Refine, CoVe and Reflexion run silently: they rewrite a worker’s output, flag a discrepancy or queue a lesson without printing a line. The dashboard shows not only that a pattern fired but what it concluded.
A pattern that is disabled, or whose guards reject the result, did nothing and stays dark.
Things that are easy to miss without it
- A compaction looks like a hang. History compaction summarizes the conversation with an LLM call of its own and holds the turn for as long as that takes. On the dashboard it is a
compactionspan that ends withappliedorskipped. - A permission dialog nobody answered. Over ACP/MCP it shows as a
client:session/request_permissioncall that never ends. - The dev server you started an hour ago.
@procprocesses are replayed when the dashboard opens, so they show up even if they started long before. - Which worker spent the requests. Each LLM request hangs from the agent that made it.
Using the page
Every process is a window of its own. Drag it by its titlebar to put it anywhere: it stays where you drop it, so three processes you want to follow together can sit side by side, and the windows you did not touch stack under each other by their real size and flow around the ones you placed. Windows may overlap; the one touched last is on top and owns the clicks. Double-click a titlebar to hand the window back to the stack. Drag any node to place it where you want: it stays there, the edges follow, the rest of its column closes up and the window of its process stretches to keep hugging it, pushing the next window down instead of covering it. To move a whole kind at once (all the skills, all the tools), drag its header, the⠿ SKILL label above the first card, or Shift-drag any of its cards; cards that show up later join the group where you put it. Cards never overlap: what you moved last holds its ground and whatever is in its way slides down. Double-click a placed card or a moved header to hand it back to the automatic layout, or Reset layout to do that for everything. Drag the background to pan, scroll to zoom, 0 or Fit to fit, Space or Pause to freeze, click a node for details. Mouse, touch and pen all work. The chips at the top show and hide processes; the legend at the bottom shows and hides node kinds.
The look is one deliberate choice: a dark terminal, the palette of the ChatCLI deck (amber, cyan, violet and green on a near-black ground, monospace throughout). The header is a macOS terminal titlebar with a thin activity line; each process is a terminal window of its own; the feed is a $ tail -f of the log. A light terminal theme is the one thing that re-dresses the chrome, since a light terminal needs a light page; a dark theme keeps the deck’s palette. The language follows your terminal.
At a glance. Six tiles sum what the shown processes report: session cost, requests, active nodes, the fullest context window, errors (with the last minute beside them) and events per second with a sparkline. Each window’s titlebar carries its own cost, requests, context fill and error count.
Finding things. / focuses the search: every node that does not match dims, matches glow (an agent matches by name or by its current action). e, the errors tile or Errors only narrows the feed to errors; the kind selector narrows it to one kind. Hidden kinds and feed filters are remembered per browser. Every model hub shows the prompt-cache hit of its last request (cache 84%), on the card and in the popover. The phase labels an agent leaves with @dash mark show as ◆ rows. Export downloads the events of the shown processes as NDJSON, what a bug report needs.
A dashboard opened in the middle of a run starts from what is live right now (running agents, connected MCP servers, background processes), not from empty.
Driving it from the agent
The agent has the same handle on the dashboard as/dash, plus a way to read what it sees, through the @dash tool, registered in agent and coder mode like @model and @agents:
summary and events read the same spool the page polls, so they say when nothing is recording and how to turn it on. Everything they return is metadata, as the telemetry itself is. status, url, summary and events are read-only for the security policy; open, off and mark run serially. The tool works from every surface, chatcli tool @dash status included; CHATCLI_AGENT_DASH_TOOL=false unregisters it.
Privacy and safety
Events carry metadata only: names, sizes, durations, statuses, token counts. The following never leave the process, and tests enforce each one:- prompt text, the task given to an agent, model output, error text
- tool arguments and tool output, MCP call arguments and results
- file paths touched by a tool
- URL paths and query strings (where API keys and bot tokens travel): only the hostname is shown
- a process command line: only the program name, and only when the first word is a plain program rather than a
VAR=valueassignment - a browser URL or anything on a page; a scheduled job’s payload, message or output
127.0.0.1 on an ephemeral port, and on top of that:
- every API call needs a random token minted at start. It reaches the page through the address once, moves to memory and leaves the address bar;
- every request must carry the exact
Hostit was bound to, which closes DNS rebinding from a web page; GETonly, a strict Content-Security-Policy, no CDN, no network calls.
Cost
With the dashboard off, each instrumented point costs one atomic load, and a process does onestat every two seconds to check the lease. No spans are built, no bodies are wrapped.
While recording, emitting never blocks: a full queue drops the event and counts the drop, and a slow consumer loses events instead of slowing the others. /dash status and /config dash show published and dropped counts.
Storage
Each process writes to~/.chatcli/pulse/<instance>/ in size-rotated segments capped at roughly 16 MB per process, with a heartbeat that tells live processes from dead ones. The automatic sweep at boot removes the spools of processes dead for more than 24 hours. On demand, /storage prune pulse removes the spool of every process that is no longer running, right away:
/storage in the command reference.
Configuration
/config dash shows both variables, whether this process is recording, the spool directory and the event counters.